Dashboards & Portfolio Analytics: Data-Driven Lending at Scale
Aug 5, 2026, 4:59:55 PMFeature Spotlight: OriginationFeature Spotlight: ServicingFeature Spotlight: Collections
 By Tim Caldwell
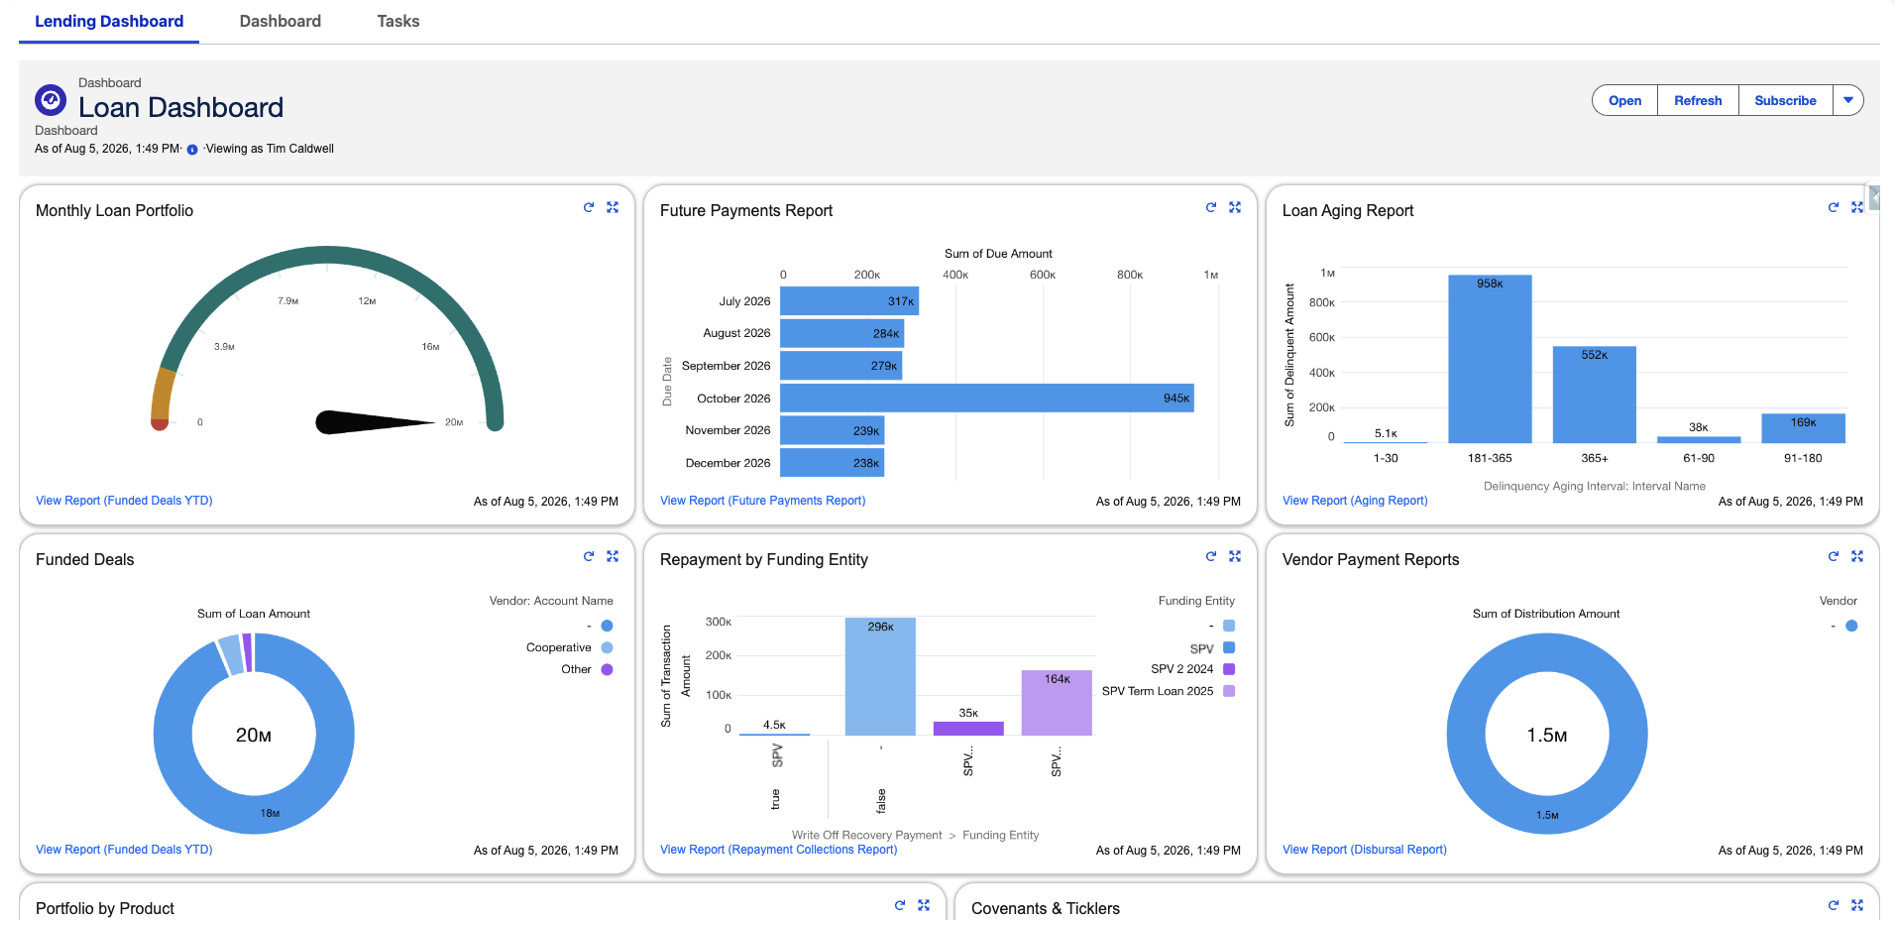
Every lender is sitting on a mountain of data, and hardly any of it is where they can see it. The problem is rarely too little information. It is that the information is scattered. Origination lives in one system, servicing in another, and collections in a third, so no one can look at the whole portfolio at once. Lending at scale means knowing how the book is performing, where it is slipping past due, and whether it is actually making money. And it means knowing that today, not from a month-end spreadsheet someone stitches together by hand. Symphonix by Q2 is built so that all of that lives in one place and can be reported on from end to end.
One platform, the whole loan lifecycle
Symphonix by Q2 is an end-to-end lending platform, and it runs entirely on Salesforce. The same platform originates the loan, services it, works collections when a borrower falls behind, and even manages participations and syndications. A loan’s full story, from the first application through servicing and into collections, lives in one connected system. There is no nightly export between disconnected platforms just to answer a question as basic as “how is the portfolio doing?” The data is already together, because the loan never left the platform.
If it is in the system, you can report on it
Because Symphonix by Q2 runs entirely on Salesforce, anything in the system can be reported on, and reported on with the very same Salesforce report builder your team already uses every day, not a bolt-on tool with its own learning curve. Want to know how often underwriters are granting exceptions, how a product line is performing this quarter, or where delinquency is starting to creep up? Each of those is just a report, built and grouped and charted the way you would build any other in Salesforce, and set to refresh and land in the right inboxes on its own. The platform brings the lending data and the structure around it, and Salesforce brings the reporting engine you already know.
Real-time dashboards, built for every role
Native Salesforce dashboards turn those reports into live, visual analytics, and each team gets the view it needs. The credit team watches its pipeline while leadership watches the portfolio as a whole. Click refresh and the dashboard updates as of right now, and a single dynamic dashboard can show each person only their own slice of the book, so no one is rebuilding the same view for everyone. Best of all, every chart is a doorway. Click a number and you drop into the report beneath it, then into the actual loan or application behind that. You go from a portfolio-level metric to a single record in a couple of clicks, with no export and no ticket to the data team.
“Everything in our system is reportable, and it all uses standard Salesforce reports.”
Built on the reporting tools your team already knows
Analytics across the entire portfolio
This is where an end-to-end platform pays off. Because origination, servicing, and collections all feed the same system, the whole portfolio sits in one place, and the same reporting turns it into the performance, delinquency, and profitability views that run the business. The picture runs the length of the loan lifecycle:
|
Stage |
What the data captures |
Example analytics you can build |
|
Origination |
Applications, pipeline, credit decisions, exceptions, approvals |
Intake volume, pull-through, time-in-stage, exception and override rates |
|
Loan Servicing |
Booked loans, balances, exposure, covenants, payments, maturities |
Portfolio balances and exposure, covenant compliance, upcoming maturities, concentration |
|
Collections |
Delinquency aging, past-due status, recovery activity |
Delinquency buckets, past-due trends, recovery and collector activity |
Loan and portfolio profitability is no different. The pricing on every loan and the way it performs afterward live on the same platform as everything else, so profitability becomes one more view you can build from the data you already have, not a separate system to reconcile.
From data to decisions
Data-driven lending is not about generating more reports. It is about having one source of truth you can actually see. With the Symphonix by Q2 suite on Salesforce, your entire portfolio, from intake to servicing to collections, is reportable, visual, and current, so you can manage performance, get ahead of delinquencies, and protect profitability as you grow.
See your whole portfolio on one dashboard. Talk to the Symphonix by Q2 team at symphonix.com.
Let's Work Together
Symphonix is designed to meet the unique demands of the personal loan market, helping you deliver faster, more efficient, and more secure loan services.